| Maintenance and Troubleshooting | << | >> |
|---|
When you are alerted to a connection problem, check the link monitor display to determine the scope of the problem and the components affected. To view the display for a link monitor, choose an existing configuration and start the monitor. Link monitor configurations are stored in the directory and are available to servers throughout the site.

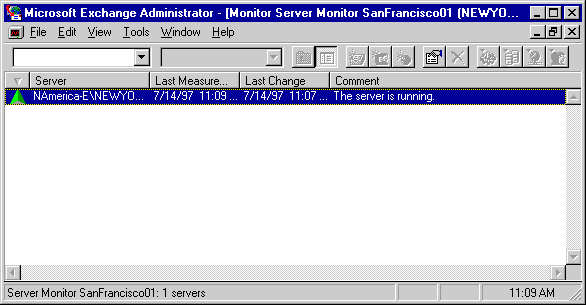
The link monitor displays the condition of monitored connections. Each line in the display represents one connection. You can sort the entries using the column heading buttons. You can also change the width of the columns to make the display easier to read.
Associate the condition of the connections to your network map. This can reveal the scope of the problem and point to the source. The comments and severity symbols depend on the thresholds set in the link monitor Bounce property page. If the alert tolerance is set too low, ping messages on fully operational connections will go into warning or alert states.
| Option | Description |
|---|---|
| Symbol | The status of the connection. The status can be up, down, in a warning state, or not yet monitored. |
| Server | The server the ping message was sent to and the server it is expected to be returned from. |
| Last Measurement | The time the last ping message was sent from the sending server. It is displayed in local time. |
| Last Change | The time that the status of the connection changed. It is displayed in local time. |
| Last Time | The round-trip time of the last returned ping message on the connection. |
| Comment | The condition of the connection between the sending and destination server as measured by the round-trip time of a ping message sent between them. |
Text in the Comment column describes the status of the connection based on the thresholds set in the Bounce property page. The following comments can appear in this column.
The ping message was returned in less than or equal to the time specified in the bounce threshold.
The last ping message was returned, but the bounce time exceeded the warning threshold in the link monitor Bounce property page. The value shows the actual elapsed time.
The last ping message sent has not yet returned, and the elapsed time has already exceeded the warning threshold.
No ping messages have been returned, and those that were sent are not yet late.